The Maze Hundreds Chart

Maze Hundreds Chart Pic

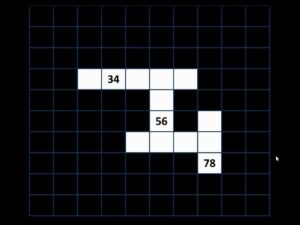
The Maze Hundreds Chart is a resource that is surprisingly powerful and leads to some very unexpected learning opportunities.

Much like The Animated Multiplication Table, this is a free, downloadable resource that will cause you to see an old, familiar chart in some new and surprising ways.

Watch the video, download the interactive resource, and then take a look at the next blog post which will feature a variety of types of questions which you may never have been able to ask your students before seeing this resource.


NOTE:  Because this is a triggered PowerPoint document, it will need to be played in PowerPoint in order to have the interactivity shown in the video.


Click here to download The Maze Hundreds Chart


Update!  The Follow-up Post is Ready:  Strategies for Using the Maze Hundreds Chart.


After reading this blog post, take a look at  THE 12 MOST POPULAR MATH STRATEGIES AND DOWNLOADS ON THIS BLOG.


As always, I would treasure seeing pictures of your classroom that show how you use this resource.  If you decide to take a picture, email it to me or connect with me on Twitter @stevewyborney

Another very popular blog post is Splat!  I’m giving away 50 (fifty!) animated number sense lessons in this runaway blog post.

You may also be interested in Math Imposter Sets, which includes a video and downloadable resources.

Introducing Cube Connectors features another downloadable resource which may also be of interest to you.

Another popular resource is Provide Massive Space to Notice.

Subscribe Here!

You will receive the latest updates as soon as they are posted!

We won't send you spam. Unsubscribe at any time. Powered by ConvertKit

Thank you for taking the time to read my blog.
maze-hundreds-chart-pic


42 Comments

  1. Patricia Poulin on March 20, 2021 at 8:04 am

    Hi! Thank you for your amazing work. I would like to know if it’s possible to represent the 100 chart with zero . In this case the colomn of zero is the same of count by 10. So it’ s a square 0 to 99 and 100 is in the last lign alone. An orthopedagogue show me this way. If it’s possible, it could be so great. Thank you for all ressources.

    Patricia from Ste-Adele (QC)

    • Steve Wyborney on April 11, 2021 at 9:14 am

      Hi, Patricia. Yes, it’s possible to do that. The numbers are all editable, so you can change each one so that it starts with 0 and goes up to 99. It would probably take about 10 minutes to do, but it sounds like it might be useful for you. Just click in each box and change each number.

  2. Laurie Lecours on January 11, 2021 at 4:55 pm

    Steve, Thank you so much for making these available. I’m working on a mac, when I open the Maze Hundreds Chart, I cannot see my. cursor and I can only click one square at a time, beginning in square 1. The downloads open in PPTX(apple presentation software).

    Is this a glitch of the apple download? Is there a work around, I’d love to use these with my kids.

    Thanks,

    Laurie Lecours
    2nd Grade
    Pittsburg (CA) USD

    • Steve Wyborney on January 12, 2021 at 4:38 pm

      Hi, Laurie. I’m guessing that the apple software isn’t recognizing a particular animation I used in PPT. I’m going to be creating a variation of that chart soon that will work across platforms.

      • Kerry on January 27, 2021 at 10:14 am

        Have you had success with making charts for google? My district is only chromebooks.

        • Steve Wyborney on February 2, 2021 at 5:10 pm

          Mostly, yes, but in a different way. I wasn’t able to transfer the maze hundreds chart to google since slides doesn’t recognize the animation, so I wrote some individual charts that will work on slides and will be releasing them as a Friday resource coming soon.

  3. Beth Guadagni on November 9, 2020 at 6:11 pm

    Wow, I’m late to the game here. Four years later: What would you think about a similar concept with a multiplication chart?

    Thank you so very much for your innovative resources; I find them invaluable.

    • Steve Wyborney on November 15, 2020 at 11:31 am

      Hi, Beth. I’ve considered doing this with a multiplication chart, but have been waiting to figure out how to make the Maze Hundreds Chart work for google slides. I love the idea!

  4. Mary Beth on November 9, 2020 at 6:10 pm

    Hi Steve,
    I LOVE the Maze Hundreds Chart. I am unable to operate it on Google Slides as I don’t have Power Point. Is there any hope you could release a slides version someday soon?

    • Steve Wyborney on November 15, 2020 at 11:36 am

      Hi, Mary Beth. Unfortunately, I haven’t been able to write a google slides version of the maze hundreds chats. The reason is that slides doesn’t have some of the animations needed to work. If slides adds on those features I will make this as soon as possible.

      • Mary Beth Porter on March 4, 2021 at 2:48 pm

        Hi Steve,
        My students are loving esti-mysteries and SPLAT!

        What feedback does Google need to get slides to play your Hundreds Maze AND your Animated Multiplication Chart? If I knew the technology, I’d ask for it!

        Mary Beth

  5. Tania on May 14, 2020 at 5:04 pm

    Hi Steve,

    Am loving the Maze Hundreds Chart, I. noticed in March a comment was made to flip the hundreds chart, just wondering if you’ve created a flipped hundreds chart yet?

    • Steve Wyborney on May 31, 2020 at 8:39 am

      Hi, Tania. No, unfortunately, I haven’t made it yet. That might be one that I’ll get to during summer. Wishing you a great day!

    • Kivette Akagi on September 3, 2020 at 2:04 am

      Thank you for your awesome 👏 slides. I love your splat game and hundreds chart. It has helped my Kindergarteners so much. Life saver!

  6. Natalie Stevenson on February 24, 2020 at 10:28 am

    This is amazing. Thanks!!!
    Would it be possible to turn it upside down and have the 1 bottom left? I tried to alter it but couldn’t figure out how to do it!

    • Steve Wyborney on March 1, 2020 at 9:00 pm

      Yes, this is something that I can do. I’ll see if I can get a new chart posted soon.

  7. Stefanie Harris on February 10, 2020 at 1:34 pm

    Hi, Steve!
    My teachers and students LOVE the esti-mysteries! In fact students get upset when they aren’t able to do “just one more”! My campus and several other campuses in my district have also begun transitioning to the Bottoms Up 100 and 120 charts. I even made a Bottoms Up decimal chart for 4th and 5th graders!
    Will you be release any splats or other puzzles like this one with that format?

    • Steve Wyborney on March 1, 2020 at 9:07 pm

      I can work on creating a chart like that on the site. Embedding the charts on the Esti-Mysteries is something that I sometimes do, and I can begin including both types of charts on some upcoming Esti-Mysteries.

  8. LAURA FRASER on October 22, 2019 at 1:34 am

    Your PowerPoints are so powerful for teaching number sense, such a help for a busy teacher, thank you. I would like to use the Maze 100 chart to develop a greater understanding of number relationships. However this year my class have been using a reversed 1-100 chart so that as the numbers get larger then they move up the chart. This make so much more sense and the children have a far better understanding. It’s just the same as you play Snakes and Ladders, you are moving from the smallest number at the bottom to the highest number at the top. I’d never really thought about it before but now I don’t know why we would ever have higher numbers going down! I would love to be able to use the 100 mazes with the reversed chart and wondered if this is something you might consider making in the future..

    • Steve Wyborney on October 29, 2019 at 4:30 pm

      Hi, Laura. This is becoming a more and more common request. I’ll have to get this posted soon! Thanks!

  9. Amber Estep on October 10, 2019 at 12:47 pm

    Hi Steve! I am a newcomer to your blog and have been using it with many of my classes 2nd-5th grade! Thank you! The Maze has been fantastic to use with 2nd grade students who are learning to use mental math to find 10 more or 10 less than a number. Do you have any suggestions of how I could modify your maze to help students understand the concept of 100 more and 100 less?

    • Steve Wyborney on October 29, 2019 at 4:47 pm

      Hi, Amber. I’m not sure how to do that on the current maze, although you have my mind spinning with possibilities. I think that a lot of conversation around 100 more and 100 less will be helpful. It may be that the chart would promote that conversation but that you can have those rich conversations without the chart. Still, you have me wondering just what it would look like.

  10. Emma Sharman on April 2, 2019 at 3:13 am

    Hi Steve
    I use your Maths Talks already and have just been shown the Maze 100 square. However, when I download it, I get a 100 square in powerpoint but I can’t see how it is interactive and all numbers are shown in white boxes. Where am I going wrong please?
    Thanks

    • stevewyborney@gmail.com on April 11, 2019 at 6:42 am

      Hi, Emma. They key is to be sure that the slide is playing in PowerPoint. It will only become interactive when the slide show is playing. I hope that helps.

      • Aimee on August 23, 2019 at 4:52 am

        I am having the same issue when I press ‘Present’. It just shows a hundreds chart. It also doesn’t show all the little boxes within each numbered box when I initially open it. Perhaps it has something to do with using a chromebook?

        • Steve Wyborney on August 24, 2019 at 8:27 am

          Hi, Aimee. Yes, unfortunately, the maze hundreds chart uses animations that are specific to PowerPoint. There aren’t any matching animations in Google Slides that work. If I find a way to make it work in slides I will certainly create it.

  11. Jane Mohr on March 31, 2019 at 12:18 am

    Thanks so much for all these incredible resources. Great to look at fresh ideas for teaching maths.

    • stevewyborney@gmail.com on April 11, 2019 at 6:39 am

      Hi, Jane. It is my pleasure to share these out! Have a wonderful day!

  12. Vicki on December 18, 2018 at 10:33 pm

    Hello Steve,
    I learned about your program at NCTM last year and I love it. However I am having a hard time downloading the Estimation Clipboard bundles. Has anyone else had issues? I love using your resources with my kiddos but I cannot access anything right now. Are they available via Google drive?
    Hope to hear from you soon.

    • stevewyborney@gmail.com on December 21, 2018 at 6:53 am

      Hi, Vicki. I just took a look at it and I think it’s all set. Just click on the blue link, such as “Bundle 1…” which will take you to the download page. Then click on the blue link on that page which will begin the download process. Here is the link to the clipboard series: https://stevewyborney.com/?p=1483

  13. Heather on December 18, 2018 at 9:08 am

    This is such a creative but simple tool. Was planning on using it with a 2nd grade small group today, but I noticed 1st graders filling in smaller number grids when I walked into their classroom (I teach K-5 Title 1 Math) and decided to throw it out there for 1st graders. I had 1st graders learning to count by 2s! They could calculate 10 more or 10 less! Notice patterns! These are all 2nd grade state standards for us. I was so impressed and this was just during my first time using it for only like 20 minutes. Can’t wait to use it more and excited for the new number sense building resource in my back pocket.

    • stevewyborney@gmail.com on December 21, 2018 at 6:59 am

      Thanks for letting me know about this, Heather! This is great to hear!

  14. Elizabeth Brandenburg on April 27, 2018 at 7:45 pm

    Steve – is there anyway you could make the outline of the boxes white instead of blue? It is very hard to see the lines in some of our classrooms even with the lights off. Thanks bunches!

    • stevewyborney@gmail.com on May 2, 2018 at 8:49 pm

      Yes, I can easily do that. I’ll email you a copy!

  15. DeLaina Ellis on March 23, 2017 at 1:17 pm

    This is awesome! I was wondering if it would be possible to recreate this resource for exploring decimal relationships. For example a 10 chart that would count 0, 0.1, 0.2… up to 10. Another great idea is a 1 chart that would count by hundredths up to 1: 0.00, 0.01, 0.02 up to 1.

    Is this something that I could easily recreate from this resource?

    • stevewyborney@gmail.com on March 26, 2017 at 8:47 am

      Hi DeLaina,

      Yes, could easily create those variations from this resource. The chart can easily be edited so that would work very nicely. The one challenge you’ll find right away will be that the numbers may not fit in the boxes. However, you can easily resize them so that they will fit. To do that, I recommend (in windows) selecting all of the boxes and then holding down SHIFT and CTRL at the same time, then while stile holding them down, tapping on < until the text you want fits in the boxes without wrapping.

  16. Karla Laurence on October 11, 2016 at 10:27 am

    Thank you for the maze!! I can tell my students is a mystery 🙂 2nd graders love mysteries.

    • stevewyborney@gmail.com on October 11, 2016 at 4:20 pm

      You are welcome! The mystery concept is a great approach!

  17. Denise Spieler on October 11, 2016 at 9:03 am

    I am having trouble as well with the download. Can’t wait to use it!

    • stevewyborney@gmail.com on October 11, 2016 at 4:25 pm

      Hi, Denise. Try clicking on this link, then clicking on the blue link that appears. If it doesn’t work there may be something like a pop-up blocker in the way. If it doesn’t work let me know, and I’ll email it to you. Thanks for letting me know! https://stevewyborney.com/?attachment_id=802

  18. Kate on October 10, 2016 at 7:12 pm

    Steve,
    This looks awesome! I’m a math coach at a school for the Deaf and I would love to share it with my staff, however it doesn’t seem to function within Google Slides or Keynote. Any suggestions for someone who doesn’t have access to MS PowerPoint?

Leave a Comment