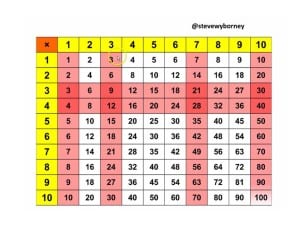
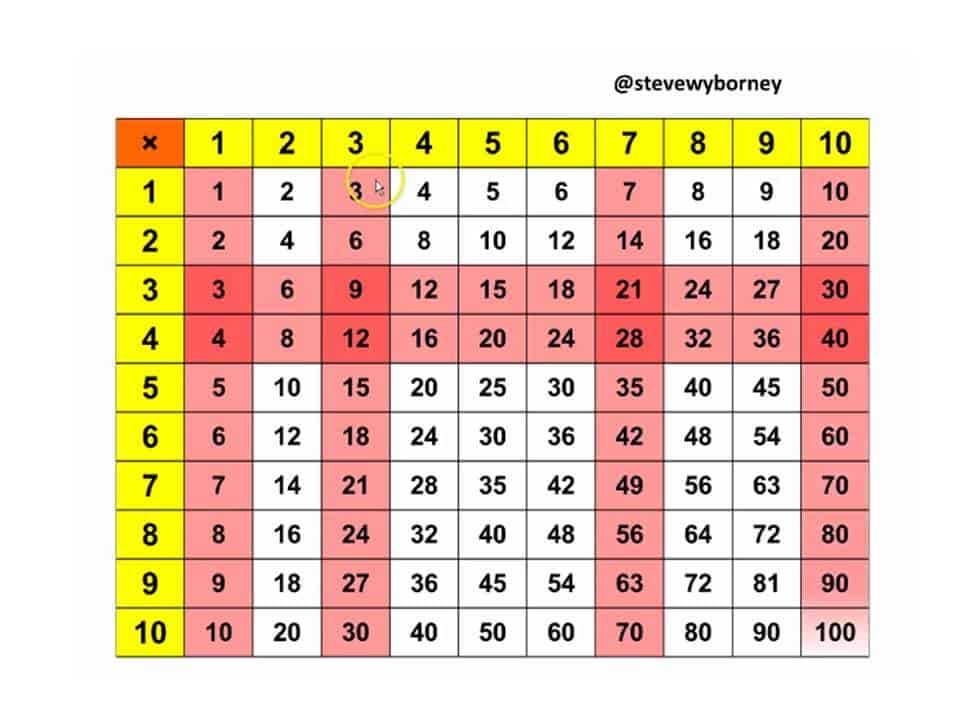
The Animated Multiplication Table

single multiplication page

I made multiplication table using PowerPoint and went on to discover some very interesting relationships within the table.

single multiplication page

You will see several here.  Watch the video below.


Click here to download the animated Multiplication Table.


(After downloading, your first step will be to click the multiplication symbol to clear the table.)


Click here to download the animated Multiplication Table.


Other posts that may interest you:


You may also be interested in viewing and downloading The Green Light Hundreds Chart.

See the updated video:  Is This Claim Always True?  A powerful post to use in your classroom.
 

Steve Wyborney Avatar

50 responses to “The Animated Multiplication Table”

  1. Amanda Keppel Avatar
    Amanda Keppel

    I love all of your materials! I am the instructional Math Coach and I use and share your materials with students and teachers in all grade levels at my school! I used the animated multiplication table recently and it has now stopped working! I tried to download again as a different file, but am not sure what has happened. I wasn’t sure if it was something behind the scenes or if there was a google slides available.

    Any advice?

    1. Steve Wyborney Avatar
      Steve Wyborney

      Hi, Amanda. Thank you for letting me know. There isn’t a google slides version available since slides doesn’t support that animation. What version of PPT are you opening the table with?

    2. Scott Cox Avatar

      Hi Amanda, I’ve been a big fan of Steve’s work too, and created an Animated Multiplication Table that works in a browser, so you aren’t constrained by Powerpoint. Here’s the link! http://www.scienceoftech.net/ZZ/AnimatedMultiplicationTable.php. Best, Scott

      1. Steve Wyborney Avatar
        Steve Wyborney

        Thanks for sharing this, Scott!

      2. Beth Baker Avatar
        Beth Baker

        Thank you, Scott! Exactly what I needed for my DL students

  2. Laura Blanco Carracedo Avatar
    Laura Blanco Carracedo

    Thank you so much for sharing these wonderful resources online. My daughter is 6 and we we’ve been using Splat. I normally work on one thing a week and was ready to move on but she wants to carry on playing. It is really helping a lot to see number bonds and to have an idea of maths beyond the worksheet and the usual notation. I find it very helpful. We will be exploring estimation thanks to you too! This is math appreciation for the whole family.
    Warmest greetings from Allariz, Spain.

    1. Steve Wyborney Avatar
      Steve Wyborney

      Thank you for this note, Laura! Wishing you all my best!

  3. Dawn Peeples Avatar
    Dawn Peeples

    Steve, it is obvious that you love what you do and it is amazing that you are willing to share to make an impact on today’s conceptual learners. Thank you for making this journey even more exciting!

  4. Rafael Avatar
    Rafael

    Thanks>> My kids are all about this new strategies to do math. Much more fun than what I grew up with.

  5. Sushant Avatar

    Thats just awesome and thank you for sharing this…

    1. stevewyborney@gmail.com Avatar
      stevewyborney@gmail.com

      Thank you!

  6. Sam C Avatar
    Sam C

    I have seen many websites with multiplication tables like this one http://math.tools/table/multiplication . First time I came across one using powerpoint. Looks nice and can be referenced while offline too. There are couple of patterns that I haven’t noticed before and you pointed out that in the video. Good post.

    1. stevewyborney@gmail.com Avatar
      stevewyborney@gmail.com

      Hi, Sam. Thanks for sharing out these links and resources. I’m glad there are so many good resources available. I’ll keep adding to the blog as I go. I have a few more posts nearing completion. I hope you will enjoy them!

  7. Julie Gottschalk Avatar
    Julie Gottschalk

    Thank you!
    And using it resulted in one of my best math lessons.
    I asked kids if they thought there were more odd or even numbers, and then we checked and discussed.
    Then we did lots of “what do you notice?” stuff. For example, somebody asked the question about what it might look (after we’d marked all the even numbers) if we then marked all the odd numbers too. There were lots of theories. Then the big reveal…
    Thanks for the great chart!

  8. Julie Gottschalk Avatar
    Julie Gottschalk

    I love this and have used it with students in the past. Unfortunately this year my school replaced my computer with one that only has google tools, so I can’t use this. By any chance, have you got a version that works without powerpoint or excel (or whatever it is. Maybe Google Slides? I

    1. stevewyborney@gmail.com Avatar
      stevewyborney@gmail.com

      Hi, Julie. I’ve checked into how to make this work with google slides, and I’ve been told that it won’t work with google slides – only with PPT. However, there may be a solution. Try downloading the free PPT viewer. That may be all that you need. It won’t allow you to create your own slides, but should let you play any slides written in PPT. Please let me know if this solution works. Here is a link. https://www.microsoft.com/en-us/download/details.aspx?id=13

    2. Scott Cox Avatar

      My note below shows how you can use an online version of the powerpoint file in an interactive HTML format.

      If you have any requests for modifying the code to meet your instructional needs, please contact me at scox at umasd.org

  9. Ann Kihohia Avatar
    Ann Kihohia

    Thank You!

  10. Ann Kihohia Avatar
    Ann Kihohia

    Fascinating! This reminds me of the arrow in FEDX Logo It has always there, we just never took a second look for details. The equivalent fractions on the timetable chart…Amazing! I’ve used this chart for practically a Century and never thought for one second to explore or discover multiple observations nor additional ways to use it to solve math problems.
    Thanks a million!!! you have opened my mind to a whole new dimension of observing the world around me on a daily basis. Equally important, you have refreshed, rejuvenated, and sparked a fresh and exciting new outlook as I plan, then engage students in all my lessons, especially Math. Thank You Thank You!

    1. stevewyborney@gmail.com Avatar
      stevewyborney@gmail.com

      Ann, thank you for this very thoughtful comment. The more I look at the chart the more I see within it. The animated multiplication table has given me a way to see it differently and that has opened my eyes as well. Let’s keep sharing out what we discover because it is so important. I really appreciate the time you have taken to share your experience with me.

  11. Anne Armstrong Avatar
    Anne Armstrong

    This a wonderful tool. I’ve used old-fashioned paper charts and colored pencils, but this is much better! Thanks for creating and sharing.

    1. stevewyborney@gmail.com Avatar
      stevewyborney@gmail.com

      You are very welcome. I a glad that it will be a helpful learning resource for your students!

  12. Joshua Zucker Avatar

    I love these patterns! It’s great to make them visual and spark some interest by making it possible for students to discover some new patterns and then wonder why they work.

    I’ve written about a few other multiplication table patterns, more aimed toward the high school level. The ideas are summarized in the form of questions in the Julia Robinson Math Festival (http://jrmf.org) activity that is linked in my blog at https://uncoverafew.wordpress.com/2015/02/05/multiplication-table-part-1/

    1. stevewyborney@gmail.com Avatar
      stevewyborney@gmail.com

      Joshua, thank you for commenting and also for sharing further resources. I’m blogging to learn, and I love that I’ve just learned some more. Thanks!

  13. Elaine Watson Avatar
    Elaine Watson

    I was fascinated by the idea of choosing 2 adjacent columns and 2 adjacent rows. A 2 x 2 square is formed at the intersection. If you multiply the numbers in each diagonal of the square, the products are 1 apart. Of course, this made me want to figure out why. Here is my “proof”:

    h h+ 1 6 7

    v vh v(h+1) 4 24 28
    v+ 1 (v+1)h (v+1)(h+1) 5 30 35

    top left to bottom right diagonal sum (let v = 4 and h = 6)

    vh + (v+1)(h+1) (4)(6) + (4+1)(6+1)
    vh + (vh + v + h + 1) (4)(6) + [(4)(6) + 4 + 6 + 1]
    2 vh + h + v + 1 2[(4)(6)] + 4 + 6 + 1

    bottom left to top right diagonal sum

    [(v + 1) h] + [v (h + 1)] [(4 + 1)6] + [4(6+1)]
    vh + h + vh + v [(4)(6) + 6] + [(4)(6) + 4]
    2 vh+ h + v 2[(4)(6)] + 6 + 4

    On the hundreds chart, when two adjacent numbers on the vertical axis are multiplied by two adjacent numbers on the horizontal axis, the top left to bottom right sum will always be 1 more than the bottom left to top right sum.

    1. stevewyborney@gmail.com Avatar
      stevewyborney@gmail.com

      Elaine,
      Wow! I am impressed! This also deeply fascinated me. Your work here is really impressive! Nice going! Wow!

  14. Scott Cox Avatar

    Just wanted to offer this to anyone intrigued by Steve’s idea: I coded a page that will duplicate the Powerpoint file, and hosted it here:
    Since it lives online, there is no need to download anything or install a plug-in. Hope it finds a place in your teaching plans….

  15. Dave Chamberlain Avatar
    Dave Chamberlain

    This is a great resource that I will share with my elementary school and middle school math-teaching colleague in my district…thanks, Steve!

    1. stevewyborney@gmail.com Avatar
      stevewyborney@gmail.com

      Excellent! I hope it will be a very useful resource for many students and teachers!

  16. Brad Avery Avatar
    Brad Avery

    Steve,

    Very nice table! I love the opportunity that this tool offers for students to visualize relationships. I was curious – the last relationship you mentioned you said pick *any* three numbers (rows) and then one number (column), and the first two products sum to the third. This would only be true if the first two number rows selected (2 and 5 in your example) sum to the third row selected (7 in your example). This would fail if say you picked rows 2, 4, and 9, and column 5, as the products 10 and 20 do not sum to 45. However, as long as the first two rows selected do indeed sum to the third, then the relationship would hold and is a nice example of the distributive property, among other things.

    Keep up the great work!

    Brad

    1. stevewyborney@gmail.com Avatar
      stevewyborney@gmail.com

      Brad, this is a great comment! Nice catch. I agree with you. Now, I’d like to go back into the recording and insert a few more words to address that. I also notice that if the rows were 1, 2, and 3 that the numbers would sum to the corresponding number in row 6. Also, if the numbers were from rows 1, 2, 3, and 4, they would sum to the number in row 10. I think there is also an interesting proportional relationship, but you’ll have to confirm this. I think that the sum of the numbers in rows (say) 3 and 5 would also be 8/7 times greater than the number in row 7. I think any other such proportional relationship would hold true. What do you think?

      1. Brad Avery Avatar
        Brad Avery

        Steve,

        The pattern you are describing deals with triangular numbers. The sum of the first n consecutive positive integers is (n(n+1))/2. So the sum of the first four positive integers should be (4(4+1))/2 = (4*5)/2 = 20/2 = 10, and 1+2+3+4 indeed equals 10. This pattern is evident in Pascal’s Triangle, and I’m sure that other commonalities between Pascal’s Triangle and the multiplication table might emerge – I wonder what relationships and patterns others may find!

  17. Terri Zapor Avatar
    Terri Zapor

    Very clever! thanks for sharing! I can’t wait to show this to my students!

    1. stevewyborney@gmail.com Avatar
      stevewyborney@gmail.com

      Great! I’d love to hear how it goes, Terri!

  18. Mark James Avatar
    Mark James

    That animated chart is so cool! Thanks for sharing!

    1. stevewyborney@gmail.com Avatar
      stevewyborney@gmail.com

      You’re welcome, Mark! Thanks for leaving a note.

  19. Pawan Avatar

    Great share.

    One comment. Towards the end (at 1:57), when you say “take any 3 numbers” and choose 2, 5, and 7, your observation only works because 2+5=7. The numbers in dark red cells won’t add like you show if you chose 2, 5, and 8, for example.

    1. stevewyborney@gmail.com Avatar
      stevewyborney@gmail.com

      That is a great point. I just read a similar note and replied to it. Thank you for mentioning that. I agree that it might point toward a different kind of relationship, which really interests me, and I never would have thought to investigate it without a comment such as this. That’s a great catch. I mentioned in the earlier post that I’d like to go back into the recording and insert a clarification there, but I’m glad I’m learning. Have a great day!

  20. Joshua Avatar

    You might like the ideas suggested here: http://www.cut-the-knot.org/blue/SysTable.shtml

    The point he makes is one, I think, you are suggesting implicitly: while most teachers think memorization and drill when they hear “multiplication table,” there is actually a lot of interesting mathematics (patterns, hypotheses, exploration) lurking there.

    Also, as previous commenters have suggested, would be great to have a copy of your powerpoint table.

    1. stevewyborney@gmail.com Avatar
      stevewyborney@gmail.com

      Hi, Joshua. I’ve added a link onto the post so the chart can be directly downloaded now. Enjoy!

  21. Simon Gregg Avatar

    Great, Steve! I too would like to use this. Could you send me a copy?

    1. stevewyborney@gmail.com Avatar
      stevewyborney@gmail.com

      Simon, I’ve added a link to the post so that the chart can be downloaded.

  22. Liza Goldberg Avatar
    Liza Goldberg

    Great PowerPoint! Can you tell me how you made the shading appear with a click?

    1. stevewyborney@gmail.com Avatar
      stevewyborney@gmail.com

      Hi, Liza. I’ve added a link so that the chart can be downloaded. About the shading appearing, try dabbling with animation triggers. Click on one thing to make another object appear. Perhaps an easier way to think of it is to set the animation you want, but then to go in and set the trigger on that animation to another object. So, when you click on X, Y goes into motion.

  23. Jen Houlette Avatar

    Just as awesome as the Hundreds chart! Love it!

    1. stevewyborney@gmail.com Avatar
      stevewyborney@gmail.com

      Thanks, Jen! I appreciate your helping me on my way on this journey!

  24. lizzie Avatar
    lizzie

    This is really interesting – thanks. I will try out some of these ideas at school – although I’m not sure I can make a table like this!!

    1. stevewyborney@gmail.com Avatar
      stevewyborney@gmail.com

      Hi, Lizzie. There is a download link on the blog post now.

  25. Christi Gilbert Avatar

    I would LOVE to use this with my students! Would you be willing to share an electronic copy of your PowerPoint?

    1. stevewyborney@gmail.com Avatar
      stevewyborney@gmail.com

      Christi, I’ve added a download link so you can copy the chart out of the blog now. Enjoy!

Leave a Reply

Your email address will not be published. Required fields are marked *